VBrandt wrote:Morning.
Do you any examples of what a client-side performance measurement looks like when you do load testing?
Thanks
Vic
We sure do Vic.
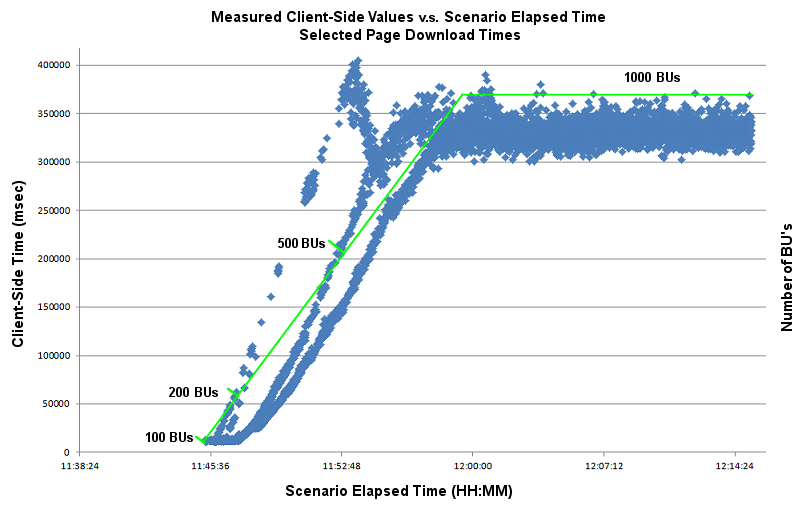
Here is a chart that shows the measure page download time for a single page of a website as the number of running eValid browsers ("browser users" or BUs) grows from 1 to 1000 over a period of about 30 minutes:
http://www.e-valid.com/Products/Documen ... 00-BUs.pngThis kind of chart is typical of what you see when you do these experiments.
Note that the scenario ran the test script over and over and over...so even at the very beginning there are many many dots on the chart.
The green bar in the cart is the system-driven number of BUs as a function of start time.
At any one point the data points (hundreds even) show the actual response time measured and recorded
The main result of the chart is that the response time grows kind of linearly as the load goes up to 1,000 BUs, which indicates a saturated channel somewhere along the pipe betwen the server and the client machines.
The key feature to note is that the response times were relatively constant until the load got up to about 175 BUs.
The implication is that the actual capacity of that server is about 150-200 simultaneous users, because after that all the server did is queue up the requests.
-- eValid Support